Amisha Gupta

Analytics & AI Engineer · Ahmedabad, India

Dashboards that answer questions. Assistants that do the follow-up.

I'm Amisha Gupta, an analytics and AI engineer with an MBA. I build Power BI dashboards, AI assistants, automations and the data pipelines behind them, so managers spend their time making decisions instead of digging through spreadsheets.

Microsoft Certified: Power BI Data Analyst (PL-300) FMCG · Retail · Healthcare · Manufacturing
Power BIAzureSnowflakedbtPower AutomateMicrosoft Teams
SOP Intelligence · Overview
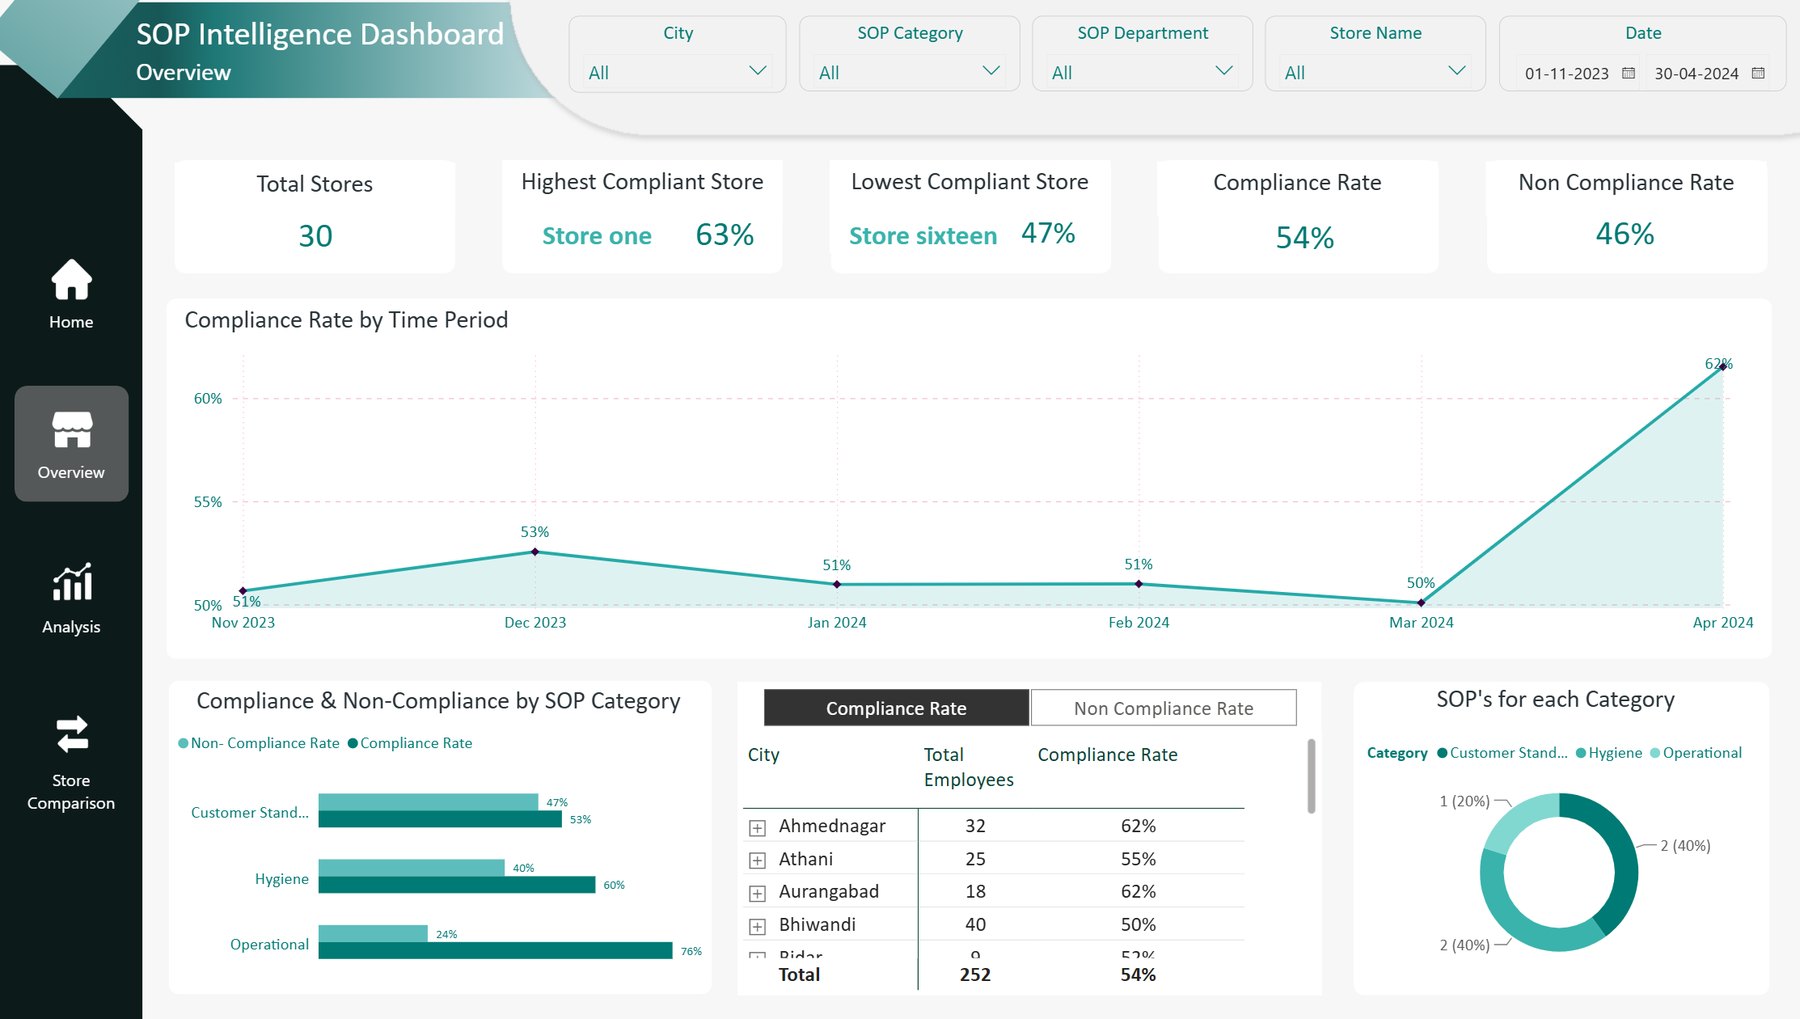
SOP Intelligence dashboard overview showing 30 stores, 54% compliance rate and a compliance trend rising to 62%
26Power BI dashboards running a global manufacturer's plants
43,543retail outlets tracked by one field sales team
100sof restaurant outlets checked for SOP compliance with AI
160project tasks scheduled by an AI assistant in minutes

What I build

Four kinds of work, one goal: fewer hours lost to chasing information.

AI assistants

Ask in plain English, get a straight answer

Type a question in Microsoft Teams and get a ranked answer with the reasons spelled out. The assistant can also update your plans, but only after you confirm.

For example: the Planner Assistant and a pricing simulator that predicts sales lift.

Automations

The follow-up happens on its own

Emails go to the right supervisor, meeting notes become tracked tasks and the weekly report drafts itself. Nobody has to remember to do it.

For example: the one-click supervisor email built with Power Automate.

Data pipelines

Trusted data behind every number

Sales systems, stores, websites and ad platforms are joined into one reliable source on Azure or Snowflake. Automatic quality checks catch bad data before anyone sees a wrong figure.

For example: a unified retail data model and an automated data-quality framework.

Featured project · AI assistant

Planner Assistant: ask your project plans a question and get a straight answer

A property developer was running dozens of plans and thousands of tasks. Finding out what was late meant digging, exports and a round of calls. Now the team just asks, right inside Microsoft Teams.

Client
Property developer (name kept private)
Where it lives
Microsoft Teams chat
Works with
Microsoft Planner (basic boards and premium schedules), Outlook email, Teams meetings, Word
Result
Status answers without digging or phone calls, and new schedules in minutes instead of days

Ask it

Tell it to do something

Planner AssistantMicrosoft Teams · chat Sample data
Why it matters

Example conversation shown with sample projects, people and dates. The client's real data is kept private.

Safe by design

It runs inside the Microsoft 365 the team already uses. There is no new system to roll out or learn.

  • Acts as youIt sees only what you can see. Your access, nothing more.

  • Preview, then confirmEvery change is shown first. Nothing saves until you say yes.

  • Verified changesAfter saving, it reads Planner back to make sure what you confirmed is what happened.

  • Audit trailDeleting anything needs an exact confirmation and leaves a record.

Featured project · AI + Power BI + Power Automate

SOP Intelligence: are 30 stores following the rules, and what should each one fix?

Built for a large restaurant chain. Machine-learning models review store camera footage and flag missed procedures. This dashboard turns those flags into scores, trends and clear next steps for every outlet and every employee, replacing manual audits.

Client
Restaurant chain with hundreds of outlets (name kept private)
AI
Machine-learning models analyse surveillance footage to detect non-compliance
Built in
Power BI, DAX, Python, Power Automate
Automation
One click emails each supervisor their team's compliance list
Power BI · Overview pageNov 2023 to Apr 2024

The whole chain on one screen

Leaders see in five seconds how the business is doing and where to look first.

  • 54% compliance across 30 stores, with the best store (63%) and the weakest (47%) named automatically.
  • The monthly trend shows compliance climbing to 62% in April, so the team can see whether changes are working.
  • Filter by city, SOP category, department, store or date, and every chart updates together.

Screenshots show an anonymised 30-store sample.

Hover to understand

Point at any chart and a tooltip explains each rule in plain words, for example "Store must open at 10:00 and close at 22:00", with its compliance rate.

Customer voice at a glance

Customer feedback comments turn into a word cloud, so the most repeated words, such as "inconsistent" or "outstanding", are easy to spot.

Featured project · Azure + Power BI

Orders Tracker: the daily pulse of a field sales team

Built for a major FMCG company whose sales reps take orders at thousands of shops every day. Data flows in automatically, and managers check it on their phones each morning: who is in the field, which shops ordered, and how this month compares with last.

Built in
Azure Data Factory, Azure SQL, Power BI (mobile and web)
Security
Row-level security, so every manager sees only their own team
Covers
135 sales reps, 43,543 outlets
Used by
Leadership, from the CEO to regional sales managers
Daily summary04 Mar 2024

Today's sales in one view

How many shops were visited, how many placed an order and what sold, by category, product and rep.

3,464 shop visits1,531 orders72% coverage₹41.08 Lac sales
Field teamAttendance and call times

Who's in the field, and for how long

Every rep's log-in time, first and last shop visit and route, plus the team's average time spent selling.

130 reps selling today4h 35m average selling time₹41.07 Lac net value
Growth and targetsThis month vs last month

Are we ahead of last month?

Green and red cards compare this month with the same point last month, and each rep's target sits next to what they've achieved.

+3.47% revenue68.2% shops coveredTarget vs achieved per rep
Past analysis3 or 6 month view, CSV export

Which shops are going quiet

Outlets are grouped as active, dormant, never visited or new, and compared with last month so lost shops get a visit before they're gone.

43,543 outlets71.7% active70.58% conversion

Employee names and the client's brand are blurred to protect confidentiality.

More projects

From factory floors to price tags.

Four more projects for global and Indian companies. Client names are kept private.

FMCGAI + Automation

Predictive Pricing & Promotion Simulator

Problem
Marketing teams kept launching discounts that lost money, because nobody could see how a price change would affect sales.
Built
A what-if simulator inside Power BI. Enter a discount, dates and region, and an AutoML model predicts the extra sales and the cost in real time.
Result
Fewer loss-making offers and a clear rise in campaign return on investment.
Power BIPower AppsAutoMLPower Automate
CPG · Manufacturing

Global Smart Factory & Shopfloor Intelligence

Problem
One of the world's largest consumer-goods companies had plants that each kept their own data, so downtime, breakdowns and purchasing delays were invisible centrally.
Built
26 connected Power BI dashboards in a single app, linking production cycles, machine health and inventory.
Result
Plant managers cut machine downtime and planned purchases from data instead of guesswork.
Power BI AppsData modellingDAX
Fashion retail

Unified Data Model & Multi-Channel Analytics

Problem
Store sales, online sales and ad spend sat in separate systems, so nobody could tell which marketing actually drove revenue.
Built
One single source of truth in Snowflake, refreshed daily from every channel, with layered dbt transformations and an executive Tableau dashboard.
Result
Much faster, scalable reporting and a clear view of return on every marketing channel.
SnowflakedbtAzure Data FactoryTableau
Cross-industryAutomation

Automated Data Quality Framework

Problem
Bad data kept breaking executive reports, and manual checks only caught it after the damage was done.
Built
A reusable framework inside Snowflake that checks new data continuously and logs every issue it finds.
Result
Hours of manual checking saved every week, with errors caught before they reach a report.
Snowflake streams & tasksStored proceduresSQL

About

I turn complex data into clear business value.

I'm an analytics engineer and consultant with an MBA, so I think about return on investment, marketing and operations as much as about data models. That's why my dashboards answer the "so what?" and not only the "what".

I've delivered for FMCG, retail, healthcare and manufacturing companies, from global consumer-goods brands to restaurant chains, covering everything from the data pipeline to the screen a CEO opens in the morning.

Based in
Ahmedabad, India
Certified
Microsoft Certified: Power BI Data Analyst Associate (PL-300)
Education
MBA
Industries
FMCG, Retail, Healthcare, Manufacturing

How we'd work together

From "we have the data somewhere" to a tool your team opens every morning.

Start with your decisions

We list the questions you answer every week and the numbers you wish you had.

Connect your data

Excel, SQL, your ERP, POS or app. I clean it and link it into one reliable model on Azure or Snowflake.

Build it with your team

You see working screens early, try them with real users and shape them as we go.

Automate the follow-up

Alerts, emails, tasks and reports run on their own once the numbers are trusted.

Power BI (DAX, Service, Mobile)Power AppsPower AutomateAutoMLAI assistantsAzure Data FactoryAzure DatabricksAzure SQLSnowflakedbtSQL and T-SQLPythonTableauRow-level securityMicrosoft Teams and Planner

Let's talk

Got a report nobody reads, or a task everyone dreads?

Tell me about it. I'll show you what a dashboard, an assistant or an automation could do for your team, using your own data.

Based in Ahmedabad, India.